Planetary Optimist
A hardware-software monitoring system that turns urban planters into biodiversity sensors, educational installations, and a city-wide game.

- Role
- Lead Designer and Researcher
- Client
- Google X
- Scope
- Hardware + Software + Coordination
- Stack
- Figma, Notebook, PKM tools, natural materials
- When
- 2022
01Overview
Planetary Optimist was an experimental urban biodiversity monitoring system developed at Google X.
Smart planters equipped with cameras and sensors were deployed across public spaces in New York, Warsaw and Poznań to collect pollinator data while engaging the public with the global biodiversity crisis happening around them.
The project was led in collaboration with 2 other designers and around 4 engineers from around the world.
02Problem
Cities lack evidence to justify investment in green infrastructure and the data that would provide it sits invisible to the people who walk past it every day.
Urban residents want to connect with local ecosystems but have no accessible way in.
The challenge: design a system that collects meaningful biodiversity data while giving the public a reason to engage with it.
03Approach
I joined as an independent design contractor in Poland (Warsaw and Poznań). I led the project end-to-end: from insect habitat research to building the physical structure to creating the public-facing digital experience, coordinating the full production and partnership chain needed to get everything built, placed, and running.
The result was a layered system:
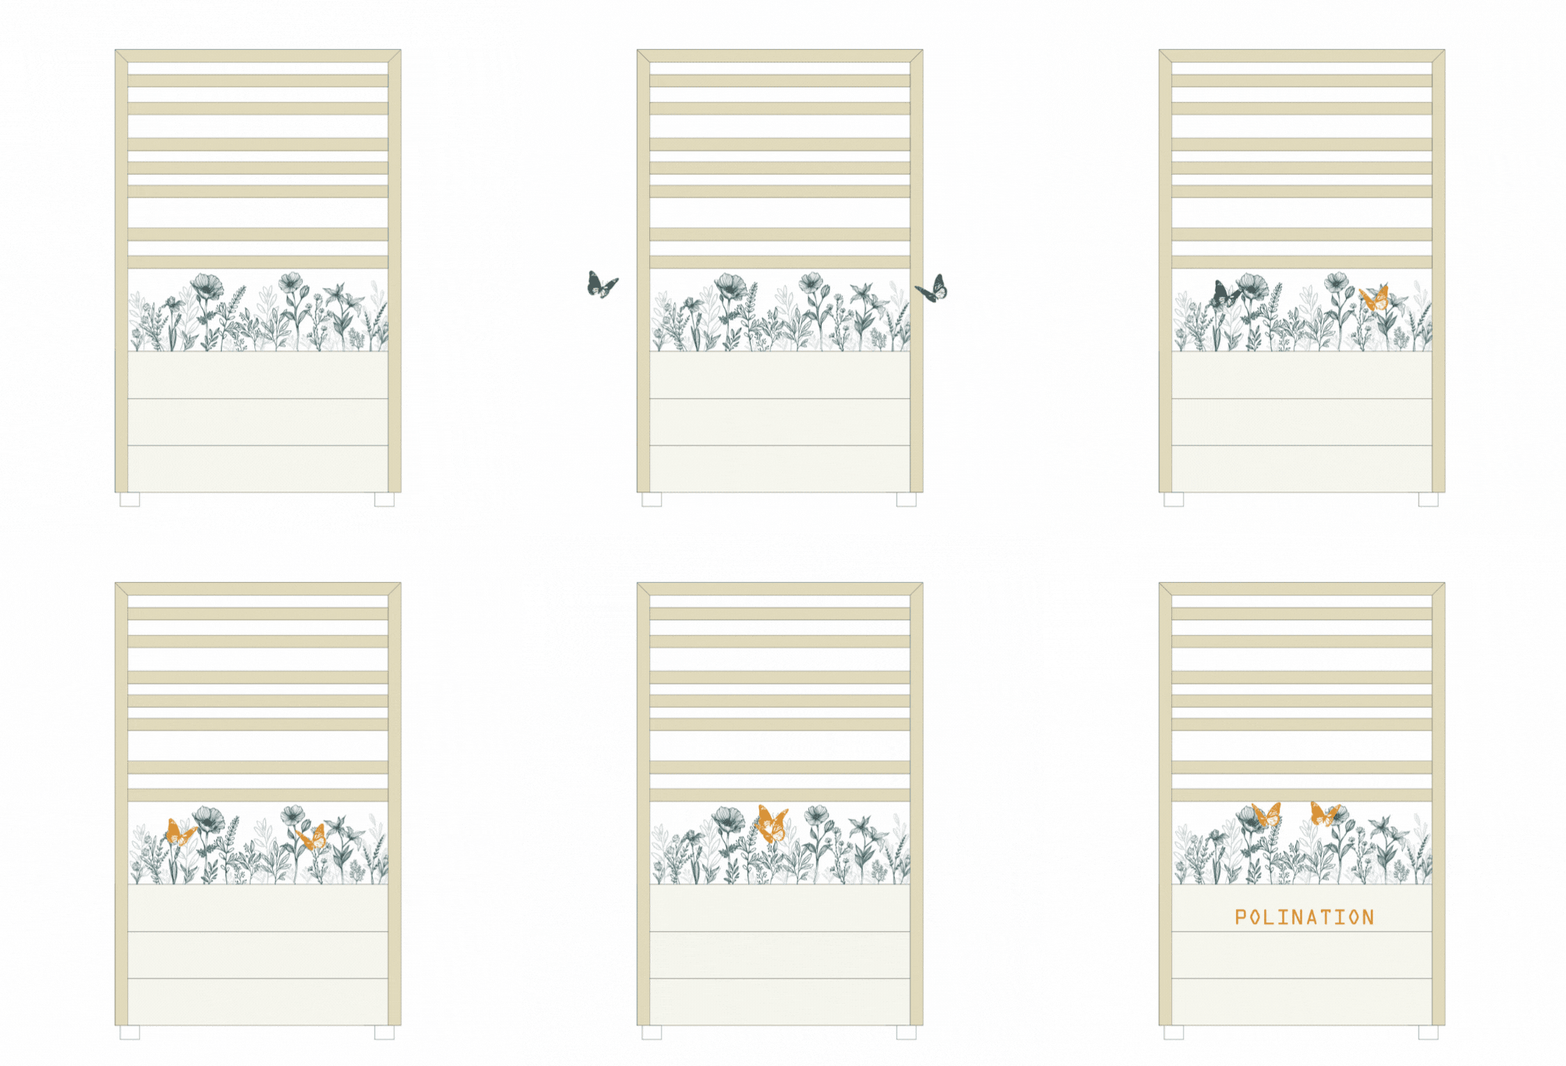
- planters designed simultaneously as insect habitat and data collectors,
- a physical data visualization built into their exterior frames,
- a mobile PWA for deeper exploration,
- and a city-wide unlock mechanic connecting all locations — each layer dependent on the others working.
04Scope of work


05Challenges
01. Designing for insects with technology in mind
Plants, colors, materials, habitats - everything had to be chosen around native pollinators.
Water-based non-toxic paints. Brushwood, pine cones, bark built into the structure as insect housing.
And underneath it all: a false bottom concealing the Raspberry Pi, cameras, and sensors: the planter serving two completely different purposes in the same physical form.

02. Hardware that had to disappear
The sensors were the point of the whole project. Raspberry Pi units, cameras, and sensors need ventilation, maintenance access, and rain protection, but the technology couldn't be visible for safety reasons.
Everything was thoroughly designed to make it sealed and invisible yet accessible for us
From the outside - nothing. The technology became invisible so the nature and structure could be the thing people engaged with.

03. Turning data into a reason to stop
Raw biodiversity data means nothing to someone walking past. Each planter's exterior frame displayed a bar chart sourced from Our World in Data — different dataset on each planter, different colors and heights.
Scanning the QR code revealed what the chart actually showed. Scrolling further unlocked that specific planter's live data: which pollinators visited today, which plants are inside and how to grow them yourself.
The map at the bottom showed every planter in the city, but each planter's view was locked until someone scanned the QR on the next one. You had to move through the city to unlock the full picture.

06Outcome
The planters could only hint at the data they held. The PWA was where that data became readable.
Each planter's frame carried a physical bar chart. Online, that chart resolved into its source: an Our World in Data dataset — biodiversity loss by continent, species decline, habitat destruction — different on every planter.
Below that: live readings from this planter alone. Which pollinators visited today. How activity shifted over time.
And a city map connecting every location — with each planter's view locked until someone scanned its QR on site.++.
10+
Locations across Poznań, Warsaw and New York
5+
External partners coordinated (Allegro, Stary Browar, Local wineries, Universities)
1
Google X patent filed

07Reflection
Data contributed to habitat optimisation research with Poznań University of Life Sciences and PCSS. The project concluded as a completed Google X pilot.
Designing for a non-human user first (insects) made the human experience better. Hardware constraints forced visual decisions I wouldn't have reached through screen-first thinking.
Running the full production chain as an independent contractor, with a limited budget and a tight timeline, taught me more about early-stage product development than any other project I've worked on.
08Summary
